bitten
An app that tracks and analyzes the driving forces behind nail biting and helps break the habit.
Challenge 1: Self Tracking
For one week, I tracked the points of contact with my mouth outside eating and hygienic care.
Hand-drawn data visualizations compared:
Days and times
Types of contact, duration, and anxiety level
Interactive Data Visualization
Designed and hand-coded interactive data visualization using P5 and Excel.
X-axis = hour
Y-axis = anxiety level and duration
Color = type of contact
Scale = alone, in public, or in a conversation
Challenge 2: Solve a Problem
I was challenged to design a solution for a problem related to my tracking. I chose nail biting, which is a common problem.

Context
Through research, I learned nail biting follows the same formula as many other serious habits.
Opportunity
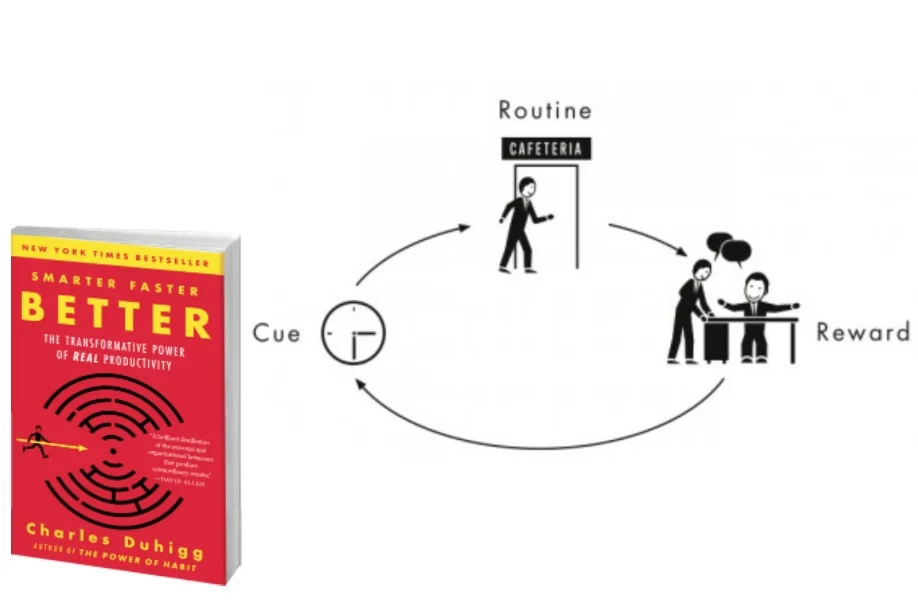
Charles Duhigg’s book Smarter Faster Better introduces the habit cycle and suggests solutions.
I identified an opportunity to apply Duhigg’s habit-breaking theory to nail biting.
Audience
Nail biters who are ready to learn more about their behavior and invest time to make a change.
Habit Cycle for Nail Biters
A psychological trigger causes chronic biters to bite their nails in order to receive a reward in the form of stimulation.
Bitten app uses data tracking to diagnose the trigger that causes users to bite their nails.
The user is provided a new ritual that’s relevant to the trigger to replace nail biting.
Bitten provides lifestyle tips and resources to prevent the trigger.
Information Architecture
On-boarding: Explains habit cycle.
Phase 1: Check-ins throughout the day
Tracks nail bites, mood, anxiety, hunger, and loneliness
Diagnoses: Identifies trigger based on data
Tips and resources
Healthier rituals to replace nail biting
Phase 2: Check-ins throughout the day
Tracks whether users bite their nails, perform a new ritual, or resist completely.
Process
Kit of Parts
Typefaces
Source Serif Black: Rough edges represent nail biting
Source Sans: Legible at a small scale and designed for digital formats
Phase 1 and 2 categorized by different color pallets.
The outlined buttons compliment the lines in the data visualizations.
Phase 1: Frequent Check-ins for One Week
Users enter data regarding nail bites, mood, boredom, anxiety, hunger, and loneliness.
Users watch their entry populate the data visualization.
It was important to make the check-in quick and simple.
Adobe XD Prototype
Final Task Flow
Process: Paper Prototypes
Process: Screen Evolution
Phase 1: Data Visualization
The entire week’s entries arranged by time of day
Users can drag their thumb to highlight each specific entry
Adobe XD Prototype
Final Task Flow
Process: Paper Prototypes
Process: Screen Evolution
Process: Screen Iteration
Phase 2: Check-ins
Less frequent check-ins based on the times of day nail biting was most frequent.
Users enter data regarding whether they bit their nail, performed a suggested replacement ritual, or avoided temptation all together.
Adobe XD Prototype
Final Task Flow
Process: Screen Evolution
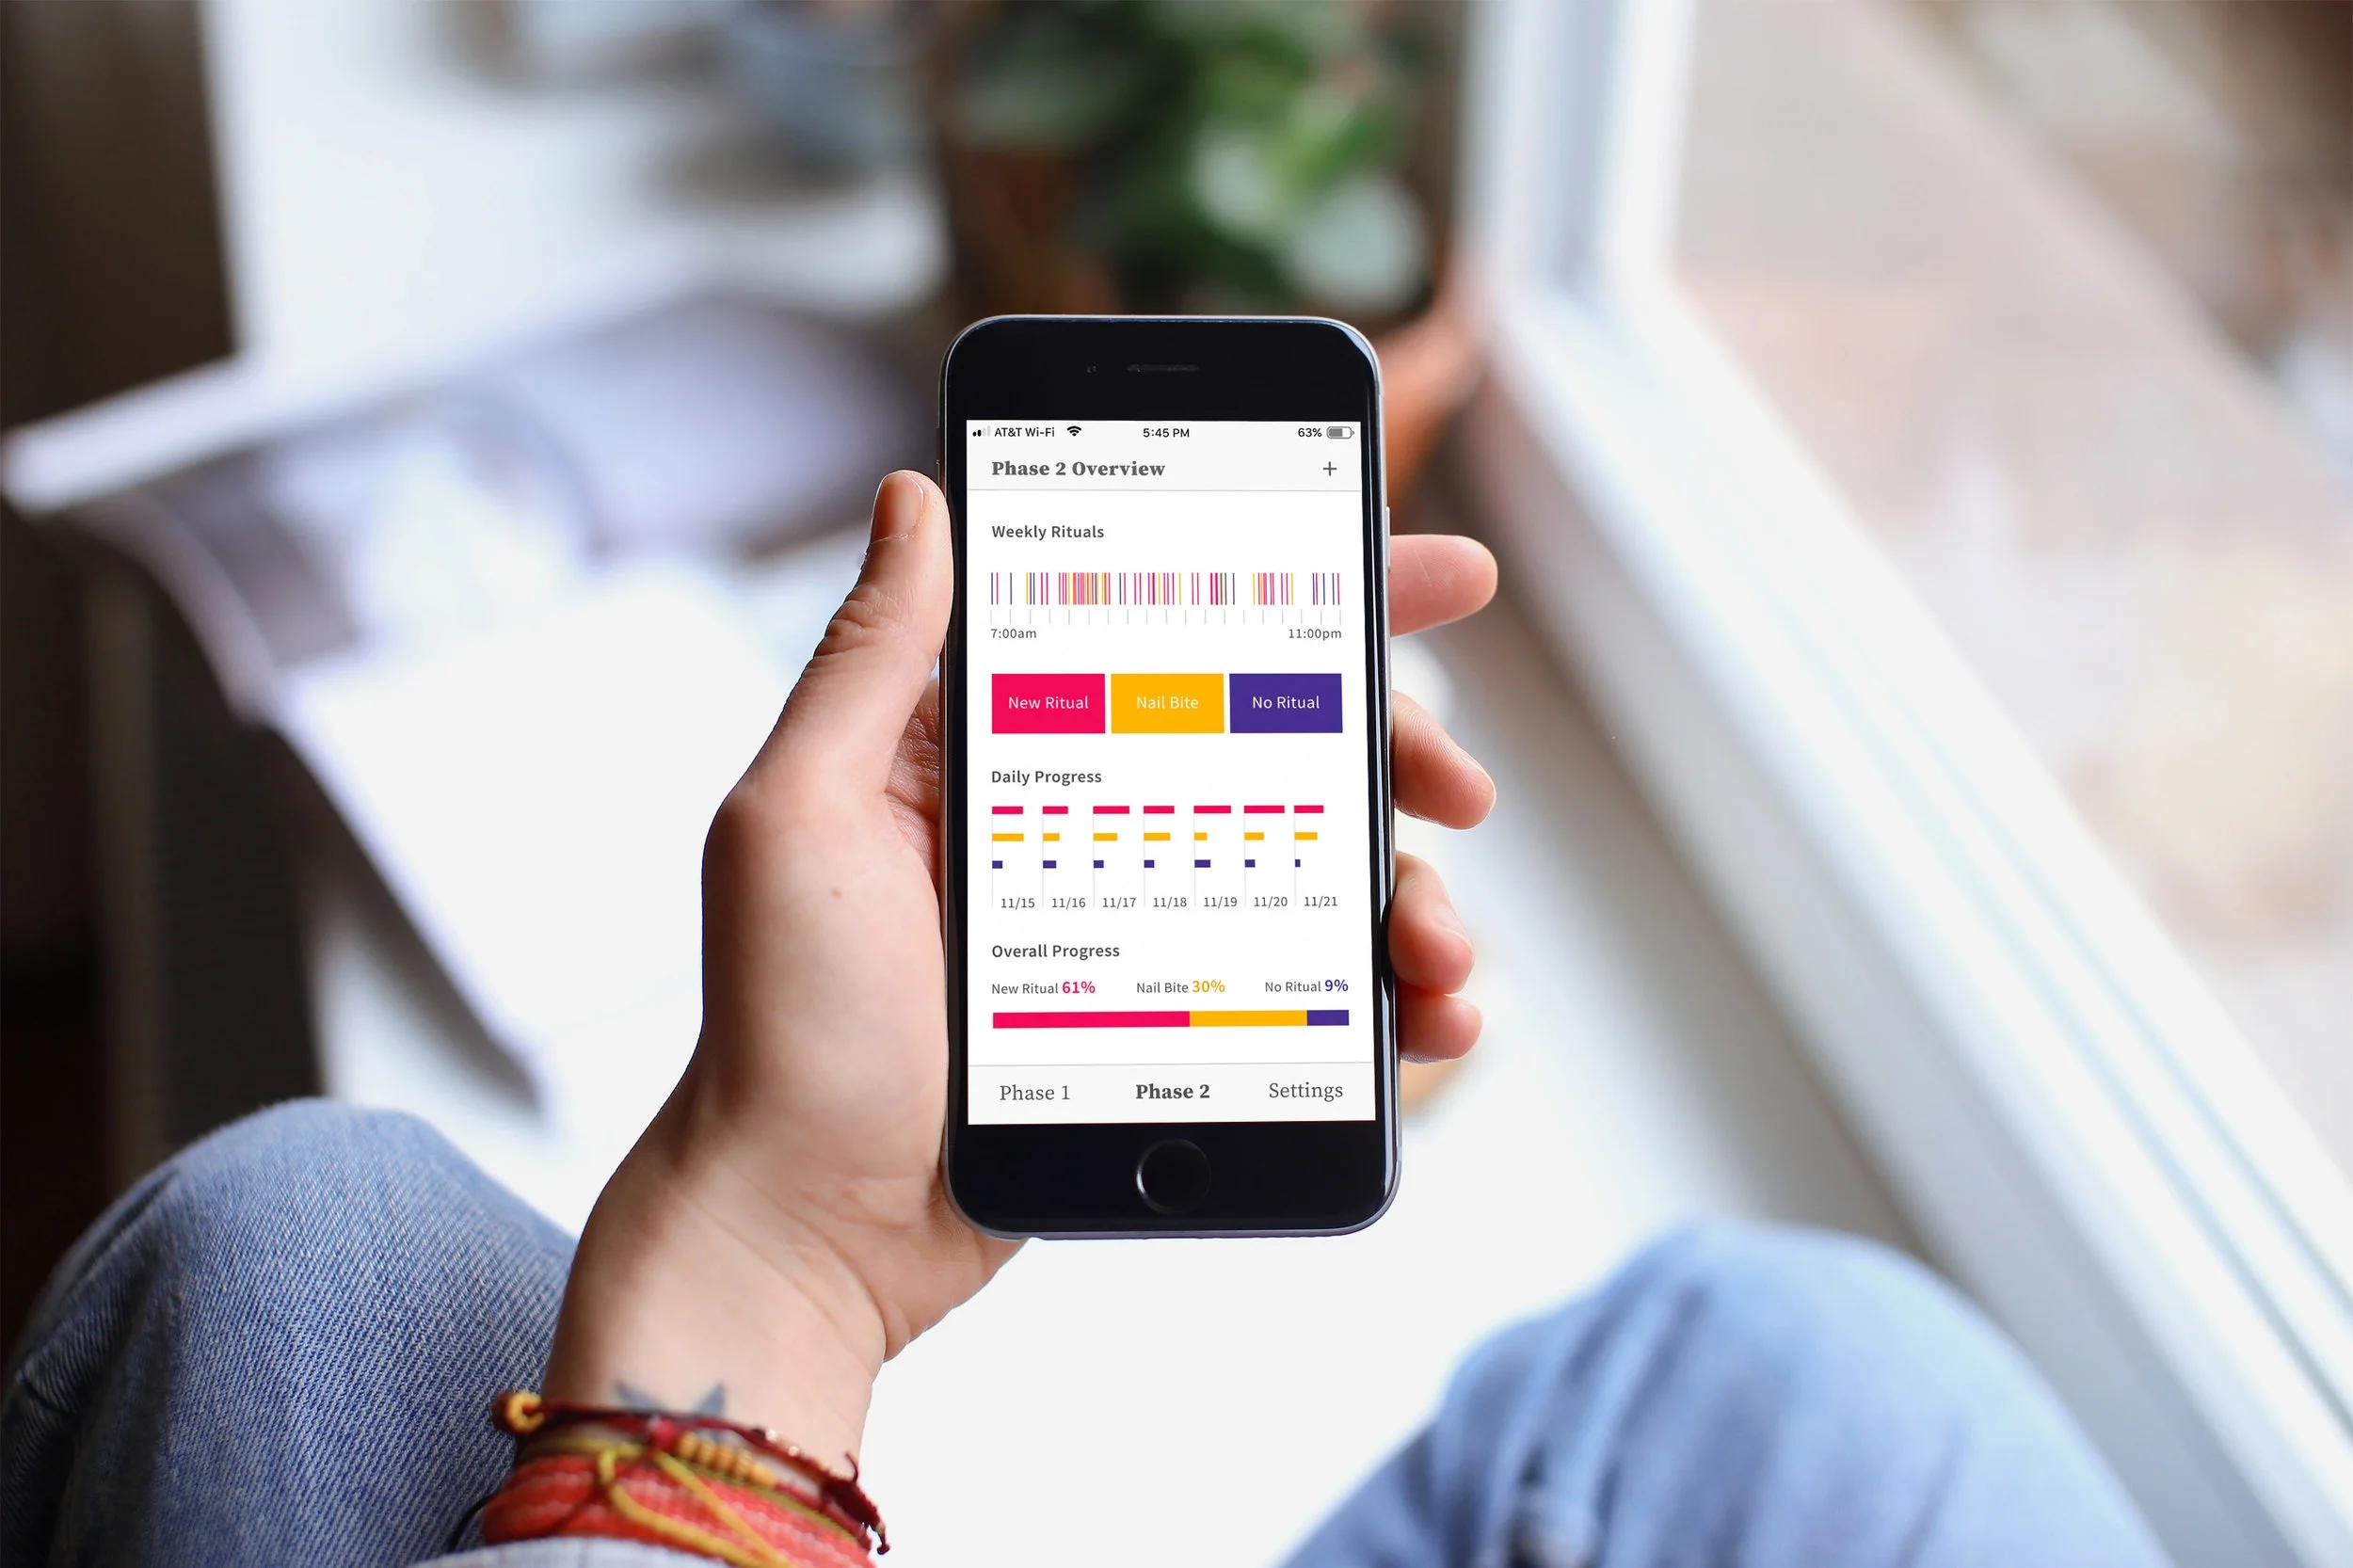
Phase 2: Data Visualization
All entries are arranged by time of day.
Users can drag their thumb to highlight each specific entry
Daily and total ratios show their progress.
Adobe XD Prototype
Final Task Flow
Process: Screen Evolution